10 Mobile App KPIs You Must Track
1. Daily Active Users (DAU) / Monthly Active Users (MAU)
- Definition: DAU = number of unique users engaging with your app in a given day; MAU = unique users in a 30-day (or monthly) window.
- Stickiness / Engagement Ratio: DAU/MAU gives you “stickiness” — how often your monthly users are returning daily. A rule of thumb: > 20% is considered good in many consumer apps.
- Why it matters: It’s a high-level signal of app health, baseline engagement, and growth viability. If your MAU grows but DAU stagnates, it suggests users download but don’t form habitual use.
Related reading: Effective User Acquisition Strategies in Mobile App Marketing
2. Retention Rate & Churn Rate
- Definition: Retention = percentage of users who return to the app after a given time (e.g. Day 1, Day 7, Day 30). Churn = inverse — the percentage who become inactive or uninstall.
- Formula (simplified):
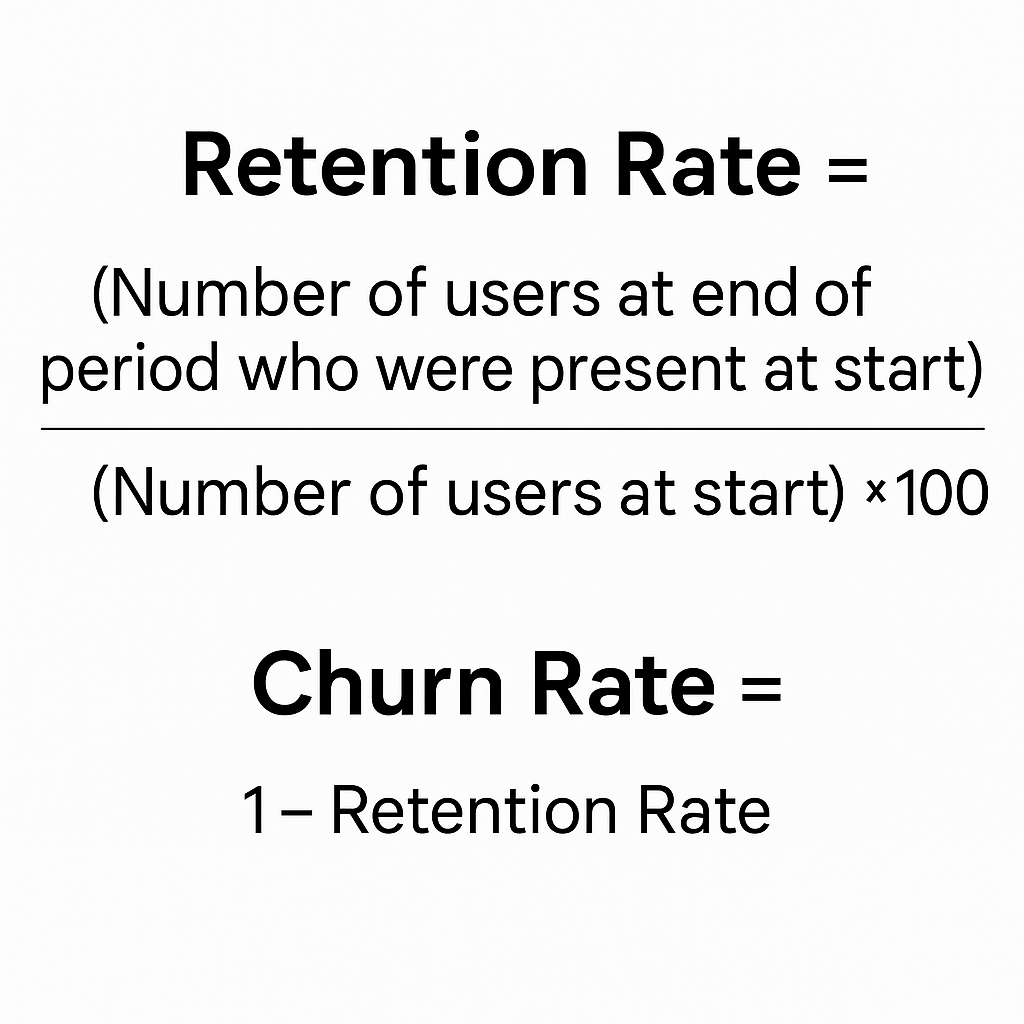
Retention Rate = (Number of users at end of period who were present at start) ÷ (Number of users at start) × 100
Churn Rate = 1 – Retention Rate - Benchmarks & statistics: On average, apps lose ~70% of users within the first week. arXiv Top-tier apps (e.g. in top 100) average ~45% loss in first week.
- Interpretation & use-cases:
- Use cohort analysis (by install date) rather than aggregating all users.
- Compare retention across versions or feature releases to evaluate impact.
- If retention is low, your onboarding, UX, or product value proposition may be off.
3. Average Session Length & Session Interval / Frequency
- Definition:
- Average Session Length = average time a user spends per app session.
- Session Interval = time between two sessions for the same user.
- Sessions per DAU = number of times a user opens the app per day. - Why it matters: These offer deeper nuance into usage patterns. Two users may both be “active,” but one uses your app for 30 minutes per session vs another just 30 seconds — that’s a big difference in depth.
- Interpretation:
- If session length drops after updates, investigate performance, layout, or engagement issues.
- Long intervals may indicate you’re not providing enough returning value, so consider re-engagement strategies (push, email, incentives).
4. Feature Adoption / Usage of Key Flows
- Definition: The proportion or number of users who use a particular core feature or funnel (e.g., create a listing, share content, complete onboarding, use chat).
- Why it matters: This is your path-to-value metric — if your core feature isn’t adopted, then your app’s killer use-case isn’t taking off.
- Approach: Create event-based tracking (e.g., using analytics, app intelligence tools and frameworks) to map funnels; compare adoption before vs after product changes.
5. Cost per Install (CPI) / Cost per Acquisition (CPA) / CAC
- Definition:
- CPI: cost for each install via paid campaign.
- CPA / CAC: cost to acquire a paying or active user (i.e. after activation). - Why it matters: For paid marketing and growth, you need to know whether your acquisition is efficient and sustainable.
- Context: App marketers treat CPI as a real KPI. But CPI alone can be misleading, you must consider downstream retention and LTV.
- Rule of thumb: CAC < LTV (lifetime value) to be profitable.
Explore our Paid Ads Services
6. Lifetime Value (LTV) / Customer Lifetime Value (CLV)
- Definition: The predicted net revenue from a user over the entire time they remain active.
- Simplified Formula:
LTV = (ARPU × Average user lifetime in days) – CAC - Why it matters: It’s the mirror KPI to CAC; used to validate sustainability and investment in growth.
- Segmented LTV: It’s best to segment by cohorts (e.g. by install month, by geography, or by acquisition campaign) to see which groups deliver highest value.
7. Average Revenue Per User (ARPU) / ARPDAU
- Definition:
- ARPU: revenue (from in-app purchases, subscriptions, ads) divided by total users over a period.
- ARPDAU: often used in gaming or ad-based models — average revenue per daily active user. - Why it matters: It’s a core monetization metric. If ARPU is high but retention is low, your app may be seen as extractive (good for short-term but risky long-term).
- Tactics to improve:
- Upsell or cross-sell features.
- Introduce ad monetization (carefully, so you don’t degrade UX).
- Offer premium subscription tiers.
8. Time to First Purchase / Time to First Conversion
- Definition: Time interval between when a user installs (or registers) and when they make their first monetized action (in-app purchase, subscription, ad click).
- Why it matters: Indicates how quickly you convert new users into paying/monetizable ones. The faster the better (lower “warm-up” friction).
- Diagnostic use: If this time is too long, improve onboarding or funnel nudges. You could A/B test incentives or offers early.
9. Crash Rate / Error Rate / Technical Performance Metrics
- Definition: Percentage of sessions (or users) in which the app crashes, errors, or experiences performance issues (e.g. API failures, latency).
- Why it matters: Technical issues directly degrade retention and user satisfaction. Even if your product is great, severe crashes drive users away.
- Other related metrics: App start-up time (cold launch), API latency, memory usage, battery consumption, network error rates.
- Goal: Crash-free sessions ≥ 99.8% (or higher) is a good benchmark, but tolerance depends on app type.
10. Virality / K-Factor / Referral Rate
- Definition: Measures how many new users are acquired through existing users (i.e. viral loops or referrals). K-factor = average number of invites sent × conversion rate of an invite.
- Why it matters: A strong viral coefficient means growth can be self-sustaining, reducing reliance on paid acquisition.
- How to instrument: Track share/referral events, invite flows, and conversion. Segment to see which referral sources or contexts work best.
Integration & Embedding: Contextual Terms & Word Embeddings
To ensure this article is semantically rich (i.e. “word embeddings” thinking, which helps SEO), include related terms and synonyms naturally:
- App engagement, user stickiness, churn prevention, cohort analysis, funnel optimization, activation flow, monetization strategy, user behavior analytics, retention curve, cohort retention table, growth hacking, viral loop, referral engine, uninstall attribution, performance telemetry, session analytics, event tracking, crash telemetry, AB test, feature rollout, cohort LTV, efficiency frontier, unit economics.
You’ll notice I already inserted many of these in context above — this helps strengthen topical relevance.
Benchmarks & Statistics
- A study of real-world app usage (162,000 iPhones over 4 years) showed that users typically stick to a small set of apps — 90% of users launch ~14–18 apps weekly.
- The classic retention study in the wild showed that 70% of apps lose users in the first week (on average) — but top apps saw ~45% loss.
- According to Braze, push notification opt-in rate and in-app messaging conversion rates are critical engagement metrics (commonly included in a top-10 list).
- In many app categories, a DAU/MAU ratio below ~10% often signals weak engagement; above ~20% signals stronger “habit formation.”
- 90% of users reported uninstalling an app due to poor performance; 86% did so because of technical issues (bugs, crashes).
These benchmarks are directional (varies by vertical, region, app type). Use them as reference, but always build internal benchmarks for your app.
How to Choose the “Right” KPIs for Your App
Not all 10 KPIs above will be equally important for every app. Here’s how to select the ones that matter:
- Determine your North Star Metric: The single KPI that best captures your app’s core value (e.g. DAU, paid conversions, LTV).
- Map your user funnel: Acquisition → Activation → Engagement → Monetization → Retention. Choose 2–3 KPIs per stage.
- Segment & cohort your analytics: Don’t just look at global metrics — break them down by geography, acquisition channel, version, device, cohort.
- Set targets & dashboards: Dashboard KPIs should be visible weekly/daily. Use alerts for anomalous drops.
- Iterate & prune: If a KPI isn’t actionable or used, remove it. Focus on metrics you can influence directly.
How Strataigize’s Mobile App Marketing Can Help You Leverage KPIs
At Strataigize, our Mobile App Marketing service is designed to help you instrument, analyze, and act on these KPIs. Here’s how we support:
- Analytics implementation & event tracking: We integrate frameworks (e.g. Firebase, Amplitude, Mixpanel) to track session events, crash data, feature usage, funnels, retention curves.
- Funnel audit & optimization: We audit your activation and onboarding flow to minimize drop-offs and maximize feature adoption.
- User segmentation & cohort analysis: We build custom dashboards for your acquisition cohorts (by channel, campaign) so you can compare LTV, retention, CAC side by side.
- A/B testing & experimentation: We design experiments tied to specific KPIs (e.g. variant A vs B for improving retention at Day 7) to optimize.
- Growth & virality strategy: We help create share/referral flows and viral loops, and monitor K-factor and referral conversion.
- Performance optimization & technical KPIs: We partner with engineering teams to monitor crash rates, latency, memory, error rates, and feed that into user retention improvements.
We often cross-link this with our blog content such as how to improve retention, how to run feature experiments, or how to optimize UA spend — giving you a holistic, integrated approach.
If you want, I can also provide you a sample dashboard template (Google Data Studio, Power BI, etc.) showing how to visualize these 10 KPIs.
FAQs
Q1. How often should I track/report these KPIs?
- Some (DAU, crash rate) should be monitored daily. Others (LTV, CAC, retention) are better viewed weekly or monthly, especially by cohorts.
Q2. What is the “best” KPI among these?
- There is no universal “best.” Your North Star might be DAU for a social app, or paid conversions for a subscription app. Other KPIs support and contextualize it.
Q3. Can I rely on app store dashboards (Google Play Console, App Store Connect) for all metrics?
- You’ll get useful top-line metrics (installs, uninstalls, ratings), but you’ll need custom analytics instrumentation for session-level, funnel-level, retention, and feature-level data.
Q4. How do I account for uninstalls (or “silent churn”) in retention?
- Use uninstall attribution tools where possible. But also infer churn via inactivity (no sessions for 30 days) or by tracking 'app removed' events (on Android, where possible).
Q5. Should I worry about vanity metrics (e.g. 100,000 installs)?
- Yes — but only if accompanied by depth metrics like retention, ARPU, etc. Install counts without downstream metrics are mostly vanity.
Q6. What tools do you recommend for tracking these KPIs?
- Popular ones include: Firebase Analytics, Amplitude, Mixpanel, Braze (for push/in-app messaging), Crashlytics, Sentry, and attribution platforms like Appsflyer or Adjust.
Q7. How much does it cost (or how difficult) to implement this tracking?
- The effort depends on app complexity. Basic funnel + session tracking might take 1–2 engineer days. Full instrumentation (crash, error, referral, cohorts) may require more. But the ROI is high because insights prevent wasted ad spend or bad design decisions.
Summary & Next Steps
Tracking the right set of KPIs is foundational to making data-driven decisions in your mobile app business. The ten metrics above — spanning acquisition, engagement, retention, monetization, and performance, form a robust core. But don’t just track them passively: act on insights (e.g. run experiments, fix bugs, optimize funnels).
If you're working with Strataigize, our Mobile App Marketing in Canada ensures these KPIs are not only tracked, but continuously optimized as part of your growth engine. Feel free to ask me to build a KPI dashboard template, suggest KPI benchmarks per industry, or map a measurement plan for your specific app.