ASO Creative Testing: A Practical Playbook
Define the audience, creative change and outcome before launching an ASO test. Estimate whether your traffic can support the comparison, use the store’s statistical method and allow an inconclusive result. Apple and Google experiments, custom pages and downstream customer outcomes answer
A useful ASO creative test answers a specific question: does this version of the store page help the intended audience take the next step? Define that step, the audience and the decision rule before producing a new icon or
Start with a meaningful change you can explain, compare it with the current page during the same period, and keep an inconclusive result in the record. Testing every quarter does not guarantee a conversion lift. Neither does copying the first screenshot from a
Choose the problem before the asset
Inspect the page on the devices, languages and store surfaces your audience actually uses. Icons, screenshots and previews can appear outside the full product page; there is no universal rule that the first two images cause most installs. Check whether the promise is readable, supported by the app and relevant to
Use observations to choose
| Observation | A useful creative test |
|---|---|
| Visitors cannot identify the app’s main use | Show that use in the first screenshot and compare it with the current introduction. |
| Reviews reveal confusion about a feature | Show the real workflow and its limits earlier in the sequence. |
| A supported language uses untranslated images | Test properly localized copy and imagery for that language. |
| A campaign promises a specific use case | Evaluate a matching custom page, with a comparable traffic source. |
These are diagnostic starting points. A conversion gap may also reflect price, ratings, product quality or a change in visitors. A cross-store average cannot isolate the effect of
Changing one asset helps explain what caused a difference. A complete concept test can also be useful: compare a feature-led sequence with a use-case-led sequence, then attribute the result to the whole package. That experiment cannot tell you which individual headline, colour or
Set up the right store experiment
Apple Product Page Optimization
Apple’s test setup supports up to three treatments against the original page, selected localizations and a chosen traffic allocation. Eligible pages include apps with a published pre-order page. Apple’s setup guide specifies a run of up to 90 days, unless stopped earlier. Confirm the available end date in App Store Connect before planning: its analytics FAQ also mentions extensions where possible. The published 90-day setup limit is neither a required duration nor a promise of
Apple’s product page optimization overview covers icons, screenshots and previews. New assets need review; alternate icons must be included in the app binary. With two treatments receiving 20% of traffic each, the original receives 60%. Equal allocation among treatments does not make the control equal
View Apple’s full-size illustration of two icon versions.
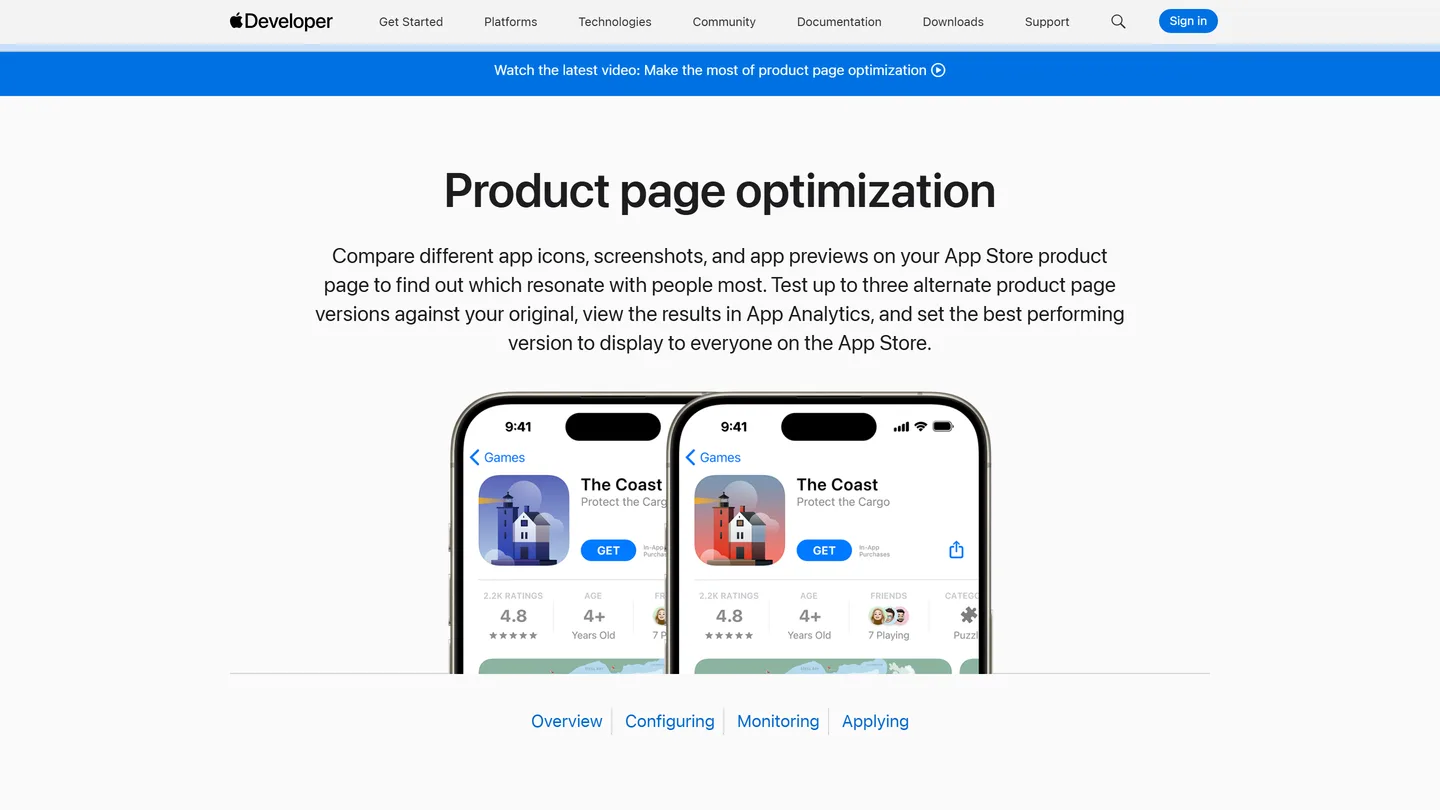
Apple illustration: the changed icon is visible in the two product pages. This is a platform example, not a Strataigize
The results documentation describes Bayesian estimates and 90% confidence labels for better or worse performance. Read the estimated lift, interval, selected baseline and test status together. A positive point estimate alone is insufficient, and an inconclusive result does not establish that two versions
Google Play store listing experiments
Google’s current setup guide allows up to two experimental variants against the current listing. It supports one default graphics experiment or up to five localized experiments at the same time. The chosen experimental audience is divided equally between the variants; the remaining audience sees the
Record the target metric exactly as shown in your console. Current setup documentation lists unique-user install, open or pre-registration clicks, while some definitions on the same page still describe completed actions. Confirm your interface and report definition before calling a click an installation. Set the minimum detectable effect and confidence level before launch, and use the console’s duration estimate for
Google reports the result with its interval and recommended action. At six months, an unfinished experiment stops collecting data and traffic returns to the current listing. It does not automatically apply a winning variant. Both stores require a decision about whether a result is useful enough
Write a test brief that someone else can follow
For a hypothetical language-learning app, a useful brief
- Question: Does a first screenshot showing the actual conversation exercise communicate the app’s use more clearly than the current feature list?
- Scope: One store and one supported listing language, with control and treatment running concurrently. Record the storefront and device filters the platform actually supports; note any mixed audience you cannot isolate.
- Change: Replace only the first screenshot. Keep the icon, remaining images, offer and product experience stable where possible.
- Measurement: Record the platform’s primary metric, numerator, denominator, allocation and baseline period. Define a minimum worthwhile improvement before launch.
- Timing: Save the start and planned end dates, reporting time zone, minimum observation period and platform duration estimate. Log releases, promotions, outages and traffic changes.
- Decision: Identify who will approve implementation, what evidence is needed, and when an inconclusive test will end.
This brief is an example, not a completed experiment. For paid traffic, also record the placement, geography, query or audience mix, and attribution window. A different campaign mix can invalidate a before-and-after comparison. Our approach to testing emerging channels uses the same discipline of stating the question and
Estimate whether your traffic can answer the question
A planning calculation can reveal an experiment that will take longer than the published test window. The following is a calculated example for a binary outcome among independent eligible participants, with one control and one treatment of equal size. It assumes a two-sided 5% significance level, 80% power and a fixed sample, using a normal approximation with pooled variance under the null and separate variances under the alternative. Counts are rounded up. The statsmodels sample-size documentation explains
| Baseline outcome rate | Detect +5% relative | Detect +10% relative | Detect +20% relative |
|---|---|---|---|
| 20% | 25,583 | 6,510 | 1,683 |
| 30% | 14,856 | 3,763 | 963 |
| 40% | 9,493 | 2,389 | 604 |
Each cell is the required number per group, not a forecast of installs. A 10% relative improvement from 30% means 33%, an increase of 3 percentage points. That example requires 7,526 participants across two groups. At 500 eligible participants entering the experiment per day, the arithmetic is about 15.1 days, so allow at least 16 full days to collect that volume. If only half the relevant traffic enters the experiment, the calendar requirement
At a 20% baseline, detecting a 5% relative improvement means distinguishing 20% from 21%. The example requires 51,166 participants in total, or about 103 days at 500 per day. That plan exceeds the setup guide’s published 90-day planning limit. Fewer treatments, more eligible traffic or a more substantial hypothesis may make a test feasible. Extending an experiment indefinitely until it looks positive is not
These figures are a feasibility check, not a replacement for either store’s statistical model. Repeat page views are not necessarily independent people; allocation can be unequal; native metrics and Bayesian estimates differ from this calculation. Multiple comparisons and repeatedly checking a fixed-sample test for an early win need appropriate statistical handling. A calculated sample size also does not guarantee a result: power is the probability of detecting the assumed effect under the
Cover the weekly pattern relevant to your app even if traffic accumulates quickly. Use a predeclared end condition and the platform’s method. If the result remains uncertain, report that uncertainty. A lead that disappears after three weeks could reflect noise, audience mix or a real change over time; its shape alone cannot diagnose a
Separate custom pages from randomized tests
Custom product pages let you match a page to a use case, referral link or eligible search context. Sending a high-intent audience to a custom page and comparing it with all default-page traffic does not isolate the
Apple reports an average increase of 2.5 percentage points when referring users to custom pages, compared with a 1.6% default-page average. Adding those figures gives 4.1%; dividing 2.5 by 1.6 gives about 156% relative improvement. The page does not disclose the sample size, observation period or a randomized comparison for that headline. Treat it as Apple’s published aggregate, not an expected uplift for your app. Creative production, localization and measurement still
For a page comparison, keep audience, source, dates and measurement definitions comparable. Use randomized routing where feasible; otherwise describe the analysis as observational and record likely confounders. Validate post-install quality only where your measurement can actually connect the page or treatment to later outcomes. Aggregate retention cannot establish that one screenshot created
Make assets that the app can support
Capture the real interface and demonstrate a task the app actually performs. Apple’s metadata rules require an accurate representation of the experience and clear disclosure when featured content needs an additional purchase. Google’s metadata policy also prohibits misleading screenshots
AI can help explore composition, backgrounds or draft copy. Our Gemini image prompts and ChatGPT visual prompts offer ways to develop those directions. Keep real UI, feature availability and substantiated claims intact. Inspect translated text, small-screen legibility, cropping and accessibility before submission. A convincing picture of an unavailable feature is a failed asset, regardless of its
Record the decision and what remains unknown
Keep a short result record with the exact assets, dates, allocation, metric definition, sample, estimated effect and uncertainty. Add the implementation date separately from the test
| Result | Practical next step |
|---|---|
| Credible improvement with useful magnitude | Check audience relevance and any measurable quality concerns, then decide whether to apply it. |
| Credible deterioration | Retain the current page and document which hypothesis failed. |
| Uncertain or too small to matter | Record no decision in favour of the treatment. Reconsider the hypothesis or traffic requirement. |
| Tracking or experiment integrity failed | Repair the setup; do not publish the comparison as evidence of lift. |
After implementation, monitor comparable cohorts. Where treatment-level downstream attribution is unavailable, say so. A store-conversion result alone does not prove incremental revenue
Strataigize provides app store optimization services, so we have a commercial interest in this work. Our historical Kleo case study reports a 127% increase in download rate and a 110% increase in conversion rate over 30 days while words and visuals changed. It does not provide a randomized control or isolate the contribution of one creative test. Use it as a case account, not a
The ASO tools comparison helps distinguish native experiments from research and external testing tools. If you need help defining the first test and its measurement, book a free growth consult.
Common questions
How often should we
Review it when the product, audience or supported markets change, and maintain a backlog of specific hypotheses. A quarterly review can be a useful planning habit. It does not require a redesign or promise a 20–30%
What if traffic is too low for an
Fix clear accuracy or readability problems without claiming experimental proof. Use qualitative feedback to refine the next hypothesis and calculate whether a larger concept change is measurable. A dated before-and-after release can be informative, but it cannot remove concurrent changes in audience, season
Should a statistically better version always
Check the size of the effect, the audience it represents and the promise the asset makes. A tiny gain may not justify maintenance across languages. A larger store-click gain can still attract users whose needs the app does