The ASO Creative Testing Playbook
App Store conversion is won in the first impression: the icon and first two or three screenshots drive the majority of install decisions. The playbook is to treat creative like paid media, test one variable at a time against store conversion, run each test to statistical significance, and scale only proven winners. Apps that test creative quarterly convert 20 to 30% better than those that update once a year, yet most apps never run a structured test at all.
Most apps treat their store listing as a one-time art project: design the icon, ship six screenshots, never touch them again. Then they pour money into ads that dump traffic onto a page nobody optimized. The creative is the conversion layer of your entire funnel, and in 2026 it is one of the highest-return things you can test. Here is how to do it like a growth team instead of a guessing game.
Key takeaways
- The first impression does most of the work. The icon and first two or three screenshots decide the majority of installs, before anyone scrolls or reads a word.
- Testing cadence shows up in conversion. Apps that A/B test screenshots quarterly convert 20 to 30% better than apps that refresh once a year.
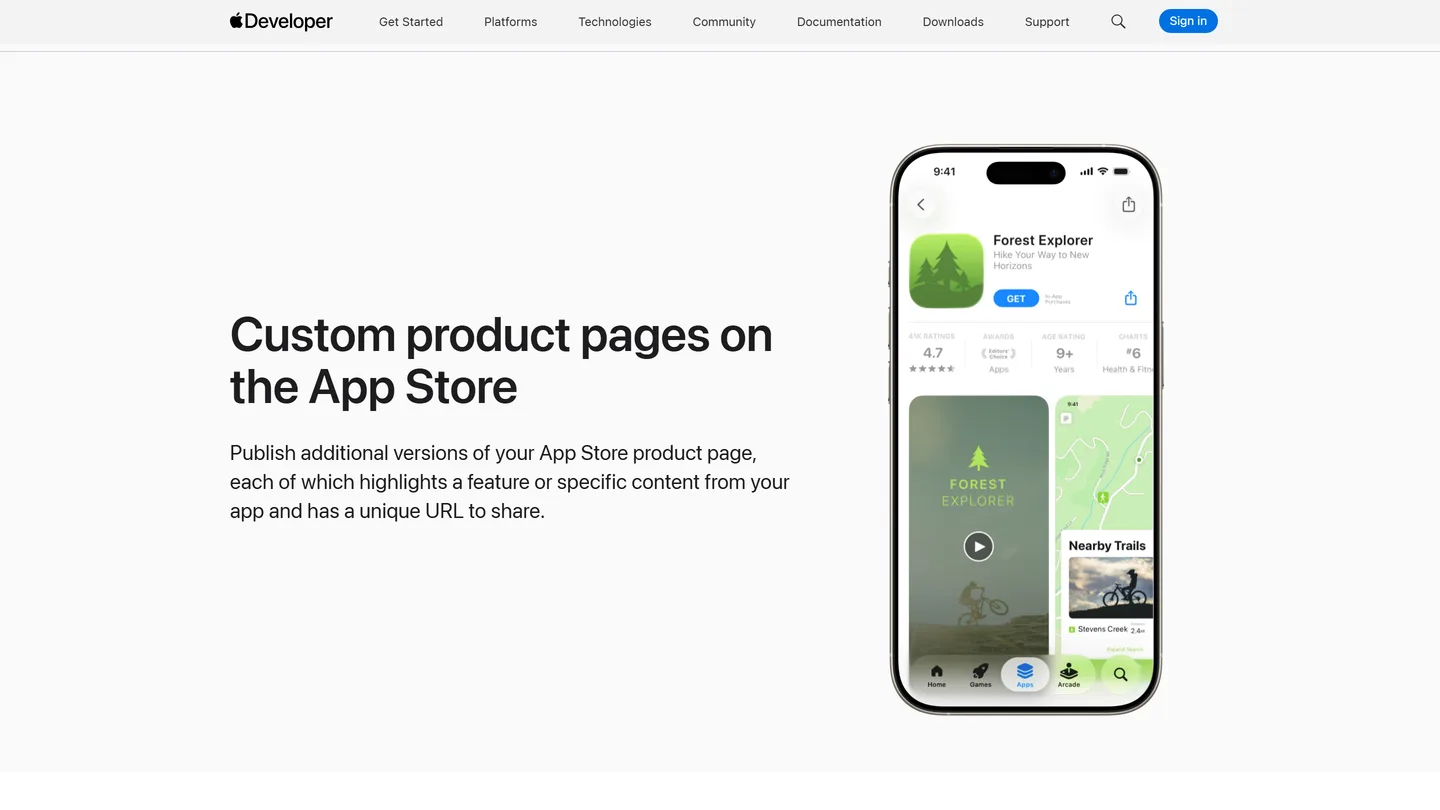
- Custom product pages are underused free money. Apple reports an average 2.5 percentage point conversion increase when people are referred to a custom product page, a 156% gain over the 1.6% average conversion rate of default product pages, and most accounts still leave them unused.
- One benefit-led first screenshot can swing it. Indie developers publishing their Product Page Optimization results report 5 to 12 point page-view-to-install lifts within 30 days of switching to a benefit-led first screenshot.
- The platforms test differently. Apple’s Product Page Optimization labels a treatment Performing Better at 90% confidence and leaves it to you to apply it, while Google Play splits visitors equally across variants and stops an experiment automatically after 6 months, so you read and run them differently.
Why the first impression decides most installs
Conversion is won above the fold, which is why the icon and first screenshots matter more than everything below them combined. When a user lands on your product page, they decide in seconds, and they decide on what they can see without scrolling: the icon, the title, and the first two or three screenshots.
The platform data backs this up. Tap-through-to-install averages about 33.4% on iOS against 27.7% on Google Play, per digitalapplied’s 2026 app store optimization statistics, and a large reason iOS converts roughly 5.7 points higher is that it renders the first three screenshots above the fold while Play surfaces the description and similar apps sooner. Strong creative pushes the top quartile of iOS apps past 45%.
That gap is the whole argument. The same app, with the same reviews and the same price, converts very differently depending on what the first frame communicates. If your first screenshot leads with a logo and a tagline instead of a benefit a user actually wants, you are leaking installs you already paid to acquire upstream.
What the creative testing data says in 2026
Creative testing is one of the few app store optimization (ASO) levers with a direct, measured line to revenue. Apps that A/B test screenshots quarterly convert 20 to 30% better than apps that update annually, per Appalize’s 2026 benchmarks.
The individual swings can be fast as well as large. Indie developers publishing their Product Page Optimization results on r/AppStoreOptimization commonly report 5 to 12 percentage point lifts in page-view-to-install within 30 days of switching from a feature-name first screenshot to a benefit-led one, per ScreenFast’s 2026 benchmarks. Those are self-reported results, not a controlled study, but they are why the first screenshot leads the priority order later in this page.
Localization compounds all of it. Apps localized across ten or more markets see 35 to 50% higher conversion than single-market apps, according to the same Appalize benchmarks. None of these are guaranteed for your app, which is exactly why you test rather than copy. But the size of the swings is why creative testing earns its place ahead of almost everything else on the ASO list.
Apple hands you a decision, Google Play hands you a signal
Both stores give you a free, native way to A/B test creative, but they work differently enough that you have to read them differently. Treating them as the same tool is how teams misread results.
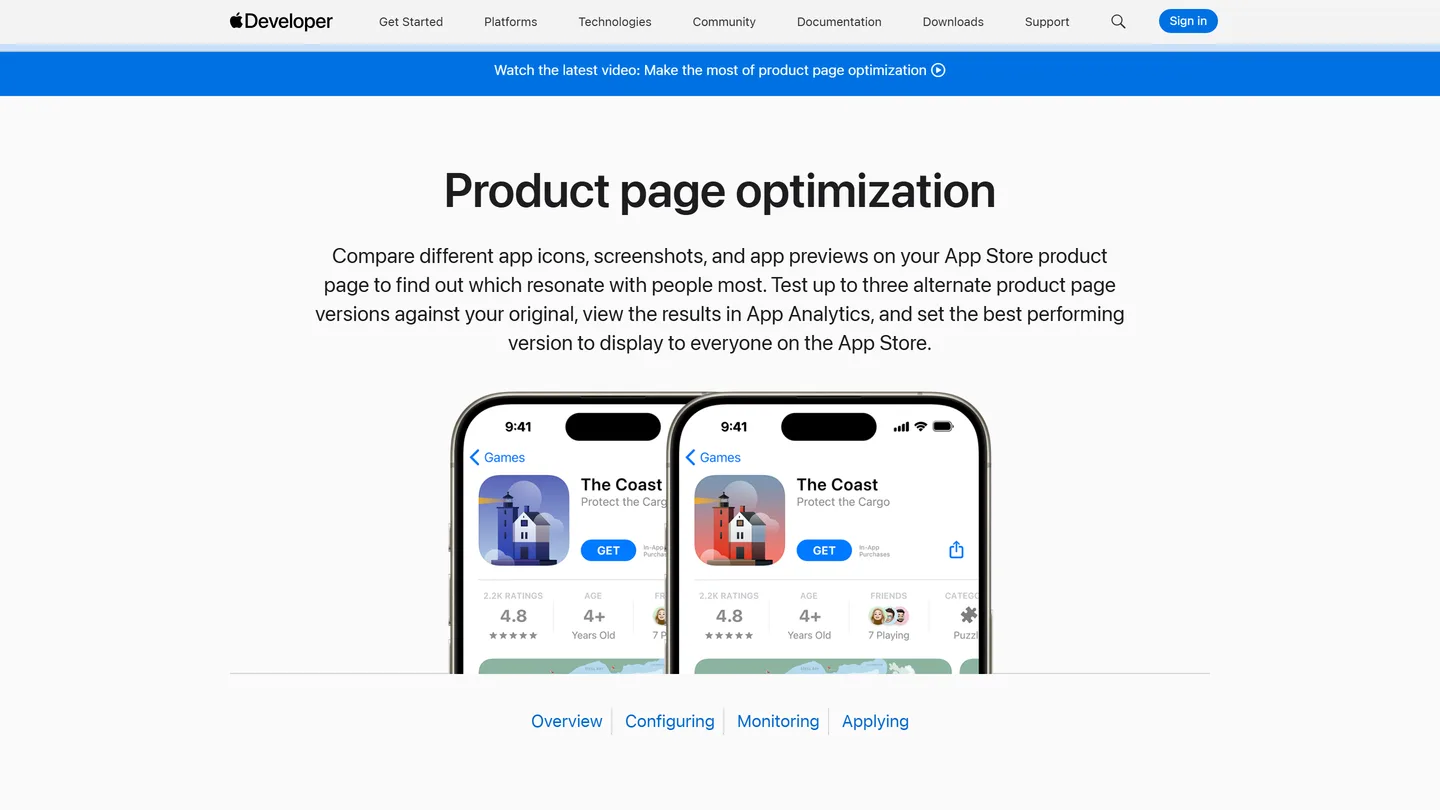
Apple’s Product Page Optimization and Custom Product Pages are the standout opportunity, because adoption is low and the lift is high. Apple’s own Product Page Optimization needs at least 90% confidence to label a treatment Performing Better or Performing Worse, which typically takes 30 to 90 days depending on traffic, and Apple reports that developers see an average 2.5 percentage point conversion increase when they refer people to a custom product page, a 156% increase over the 1.6% average conversion rate on default product pages. The pages cost nothing to build. That is a high-return lever most listings still leave untouched, and under-adopted levers are where the early advantage lives, the same logic as why we test emerging channels before they are obvious.
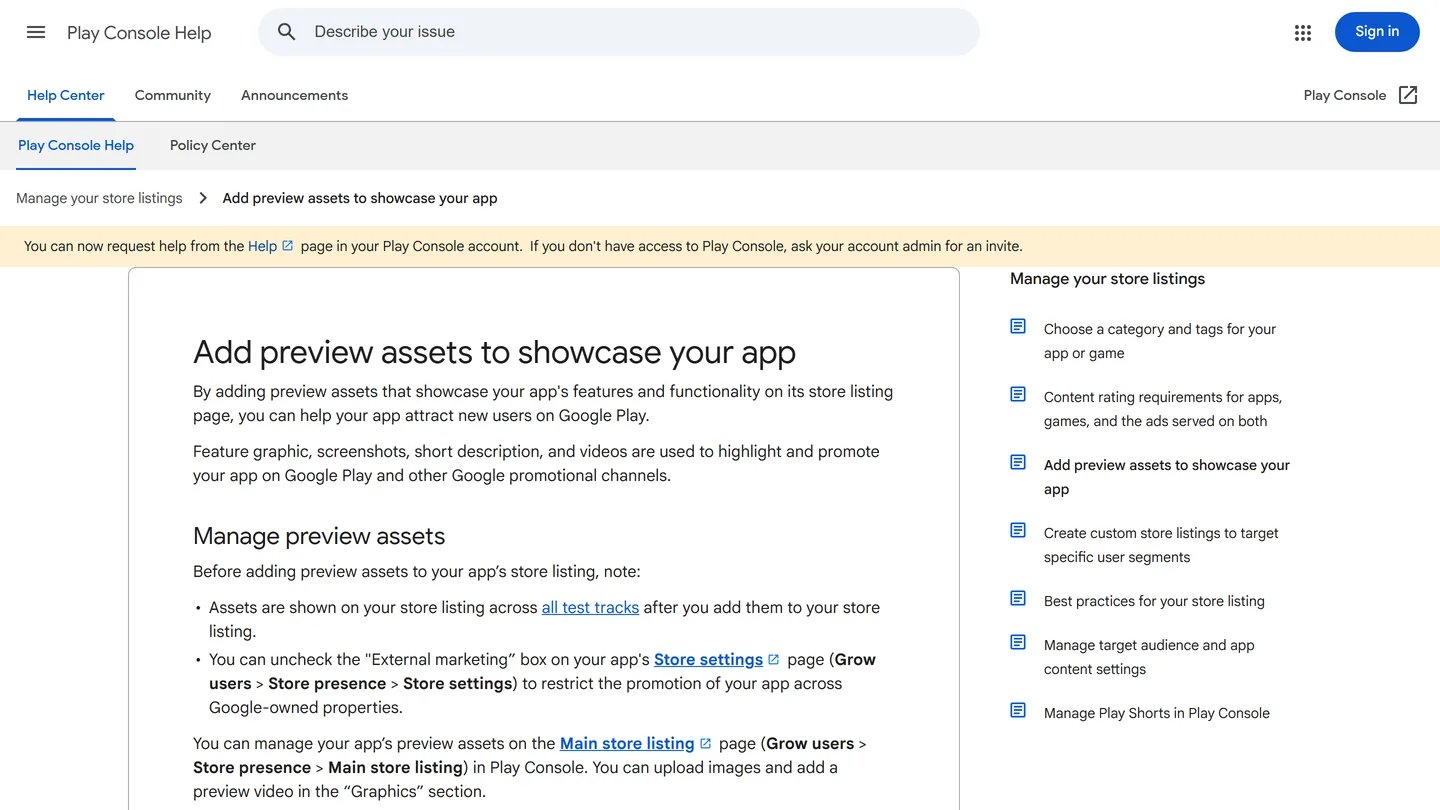
Google Play’s Store Listing Experiments behave differently under the hood. Apple reports each treatment against the baseline and leaves the decision to you: once a treatment is marked Performing Better, you apply it to the live product page yourself. Play splits eligible visitors equally across your variants, reports the result with a confidence interval and a minimum detectable effect, and stops an experiment automatically after 6 months if you have not ended it. In practice that means you read Apple’s result as a decision to act on and Play’s as a signal with an expiry date, and you give Play a little longer before you trust a call.
How to test creative like a growth team
You test creative the same way you test paid media: one variable, a real significance bar, and discipline about scaling only proven winners. The reason most ASO tests fail is not the tool, it is the method.
The loop is four steps. Change one variable at a time. Test the icon, or the first screenshot, or the screenshot order, but not three at once, or you will never know what moved the number. Form a real hypothesis. “A benefit-led first screenshot will beat our feature-led one” is testable; “let’s freshen things up” is not. Run to significance, not to a hunch. Give the test the 30 to 90 days the platforms need at your traffic level, and resist calling it early when an underpowered sample is still noisy. Scale only winners, then test the next variable. Ship the proven variant, lock the gain, and move to the next element that moves conversion most.
That discipline is the entire difference between creative testing and creative guessing. The teams that compound conversion are not more creative, they are more systematic.
What to test first, in priority order
Some creative elements move conversion far more than others, and your traffic is finite, so test them in that order. Burning your first test on a button color is how programs stall before they prove value.
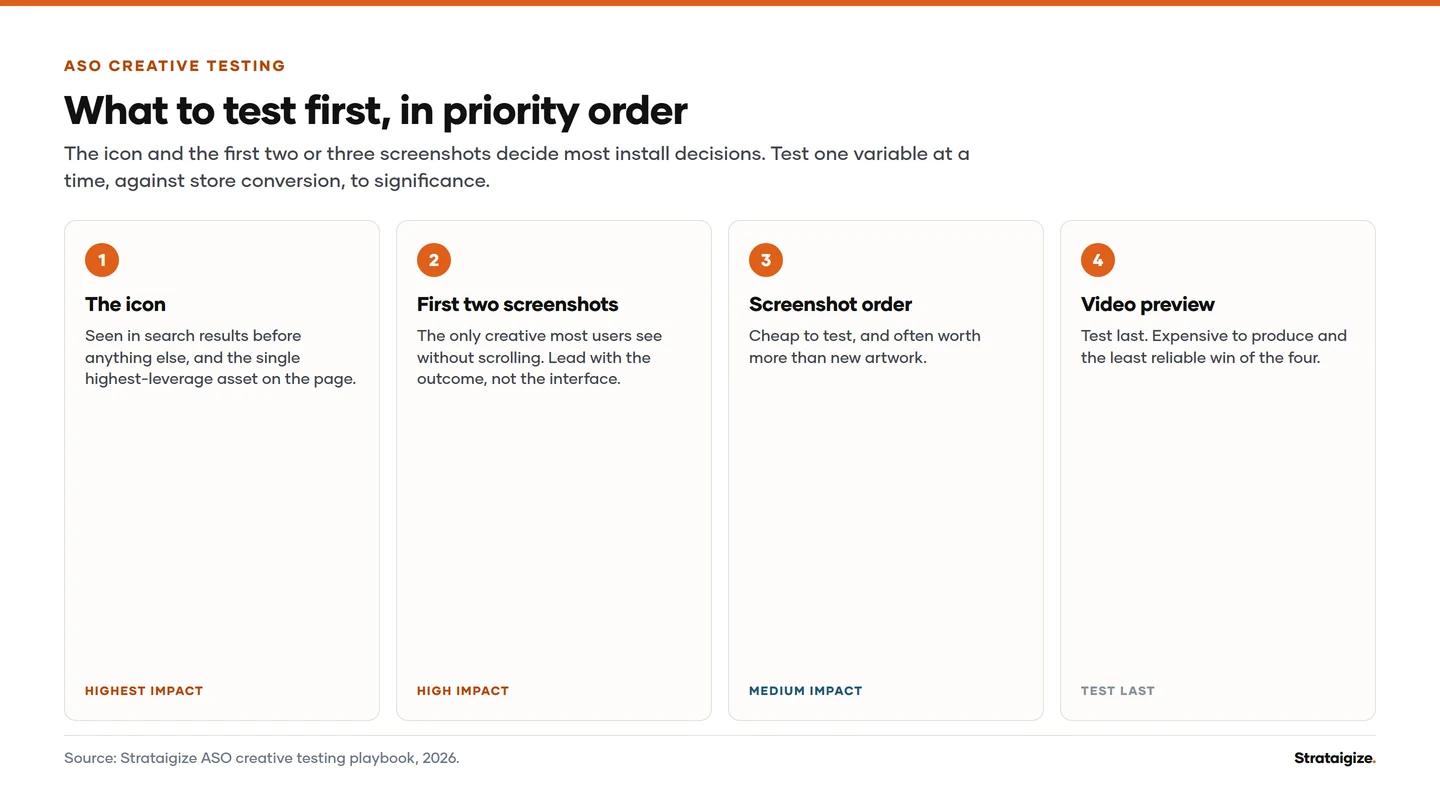
The rough priority for most apps: start with the first screenshot, since it does the most work above the fold and the benefit-led swing is the fastest measured win. Then the icon, which is the only creative element visible in search results and ads, and which has produced double-digit conversion swings on its own. Then screenshot order and the first three frames, arranging your strongest proof up top. Then localization of those creatives for your biggest non-home markets, where the 35 to 50% conversion gap lives. Below that sit captions, video previews, and background styling, which matter but rarely move the number like the first frame does.
This order is not a law, it is a starting hypothesis you confirm with your own data. But it keeps your earliest tests on the elements most likely to produce a win you can take to the rest of the program.
Supply is the other half of the problem. A testing cadence only works if you can produce enough distinct variants to fill it, and that is where most programs stall long before the statistics do. Generative image tools close the gap once the brief is specific enough to control lighting, framing and negative space, which is exactly what a store screenshot needs. Our Gemini image prompts and ChatGPT prompts for stunning visuals guides cover the prompt structure that produces usable creative rather than generic stock art.
How long to run a test and when to call it
Run each creative test for the 30 to 90 days the platform needs to reach significance at your traffic, and do not call it before then. The most common way teams fool themselves is stopping a test the moment a variant edges ahead, when the sample is still too small for the lead to mean anything.
Two practical rules keep you honest. First, let traffic volume, not your patience, set the clock: a low-traffic app simply needs more calendar time to gather a trustworthy sample, and rushing it produces confident-looking nonsense. Second, watch for novelty effects, where a new creative spikes briefly because it is different, then settles. A winner that holds across the full window is real; a winner that fades by week three was noise. When in doubt, the platform’s own significance flag is a better judge than your gut.
Common ASO creative testing mistakes
Never testing at all is the expensive one: guessing at a redesign every year and hoping, while structured quarterly testing converts 20 to 30% better and the apps that skip it leave that lift on the table indefinitely.
The rest are subtler. Teams change several elements at once, so even a winning result teaches them nothing about what to do next. They leave custom product pages unused while competitors quietly bank a 150%-plus relative lift. They call tests early on underpowered samples and ship “winners” that were statistical noise. And they treat the home market as the only market, ignoring the 35 to 50% conversion gap that localized creative unlocks.
How we run ASO creative testing
We run creative testing as a continuous program, not a once-a-year redesign, which is why our app store optimization work starts by instrumenting the funnel and then testing whichever element moves conversion most. One variable, a real significance bar, proven winners scaled, then the next test. The store listing stops being a static art project and becomes a conversion engine that improves every quarter.
That approach produced real movement for clients. In our work with the language app Kleo, ASO and creative testing drove a 127% increase in downloads, because the listing was treated as something to optimize, not decorate. If you want to run these experiments with the right instrumentation, our roundup of the best ASO tools is a useful starting point, and if you would rather see where your own listing leaks installs first, a growth audit will map it for you.
Frequently asked questions
How often should I update my app store creative? At least quarterly. Apps that A/B test screenshots quarterly convert 20 to 30% better than those that refresh once a year. Cadence itself is a competitive advantage.
Are custom product pages worth setting up? For most apps, yes, and they are underused. Apple reports an average 2.5 percentage point conversion increase when people are referred to a custom product page, a 156% increase over the 1.6% average conversion rate of default product pages, and the pages are free to build. That makes them one of the highest-return, lowest-competition levers available.
Talk to us