The Ads Data and the Revenue Data Disagreed
The app had been stuck on a plateau for months: ad spend ongoing, top-funnel activity rising, and little to nothing converting to paid. Revenue was flat, and nobody could say why from the dashboards alone.
The core issue wasn’t traffic. It was trustworthy data. Google Ads reported strong engagement metrics, but RevenueCat told a different story. Trial spikes weren’t turning into paid users, and spikes like that had previously brought billing errors, trial abuse, and churn with them. Nobody could scale on numbers that contradicted each other.
For subscription-based apps, accurate tracking is the foundation of growth. Without alignment between Google Ads, Firebase, and RevenueCat, bidding algorithms optimize toward the signals they can see: installs, clicks, trial starts. Revenue never enters the calculation. The client came to Strataigize to diagnose why conversions were broken, fix the cross-platform data inconsistencies, and build a system that could scale revenue.
Two dashboards that disagree is a common position to be in, and it is worth checking before you touch a bid. If your ad platform and your billing platform report different truths, every optimization you make after that is a guess.
Fixing the Signals Came Before Spending More
Strataigize built a data-first, revenue-aligned Google Ads strategy and repaired the signals before scaling any spend.
1. Resolving data inconsistencies across platforms
The first and most critical step was correcting how Google Ads interpreted app events. It had been optimizing on unreliable purchase-value signals, which sent the algorithm chasing volume. We audited Firebase, Google Ads, and RevenueCat event mappings, identified unreliable historical purchase data, switched bidding from In-App Actions Value (Purchases) to In-App Actions (Purchases), and reconfigured the conversion hierarchy so Purchases became the primary optimization signal and all other events were observation-only. That let Google Ads relearn who is likely to buy. It had been guessing at value far too early.
2. Funnel clarity without algorithm pollution
We added funnel events for visibility only and left bidding out of it, so we could watch the whole funnel without bending it.
| Secondary event added | Purpose |
|---|---|
| Trial Start | Measure intent quality |
| Paywall Reached | Diagnose drop-off points |
| Account Creation | Funnel visibility |
3. Revenue-driven geographic optimization
Using RevenueCat’s trial-to-paid and conversion-to-paying views, we identified which markets actually generated revenue rather than volume. We concentrated on high-quality markets (United States, Canada, Nigeria), removed high-install and no-paid markets (India, Pakistan, Bangladesh), and added high-intent expansion markets (United Arab Emirates, Saudi Arabia, Oman, Qatar, Singapore). Install volume went down on purpose. Revenue per install went up.
4. Intent-based messaging and audience strategy
Ad copy and targeting were rebuilt to filter out low-intent users before they installed: positioning the app clearly as a paid, premium security product, removing misleading “free” implications, adding keyword-based audience segments aligned with purchase intent, and reducing reliance on broad in-market segments to avoid trial abuse. The goal was better trials. Fewer of them was an acceptable price.
Turning ads away from cheap signups feels backwards on the day you do it. It is the same instinct that stops most accounts from ever fixing this.
5. App store optimization (ASO) pulled its weight too
While paid traffic quality improved, organic performance surged, reinforcing overall growth. The terms it climbed for were virtual private network (VPN) searches, the ones people use when they want their connection hidden.
| Keyword | Rank | Monthly search volume |
|---|---|---|
| USA VPN | #7 | 5 to 10K |
| VPN USA | #8 | 5 to 10K |
| Free USA VPN | #9 | 1 to 2K |
First Paid Conversions After Months of Zero
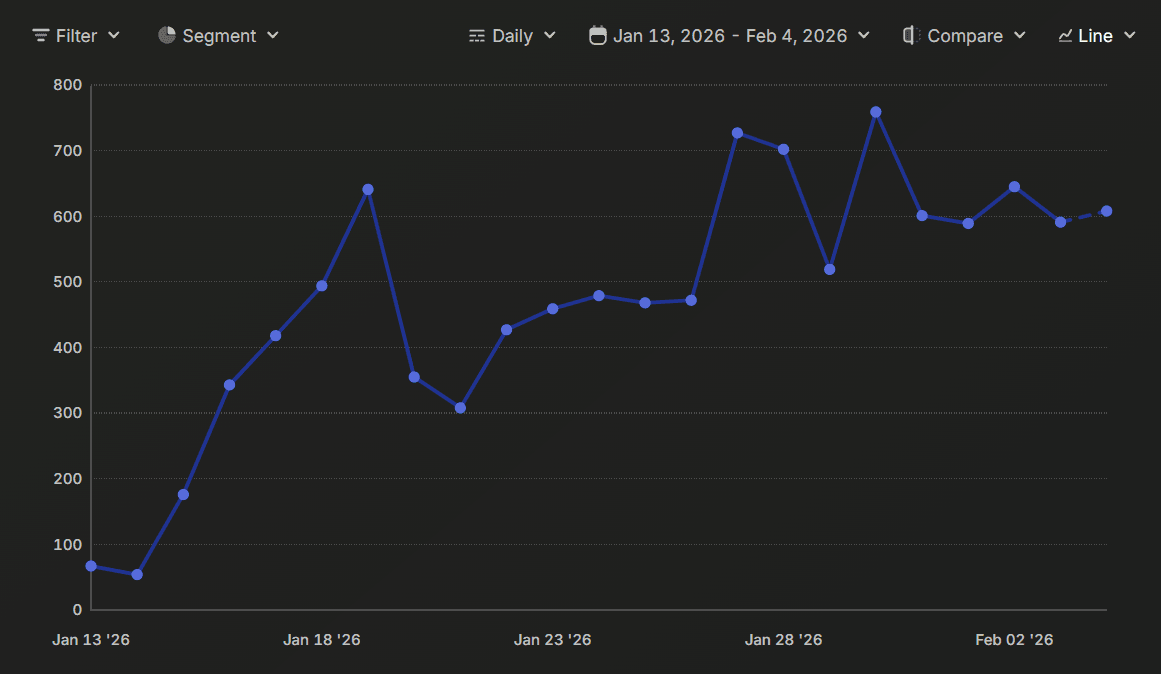
The first table is the app overall, every channel included, over the January 13 to February 4, 2026 window shown in the screenshot; the second is the Google Ads funnel alone over the 10-day read noted in its header. The windows differ, so read them separately and do not divide one by the other.
| Metric | Result |
|---|---|
| Total new customers (paid + organic) | 11,770 |
| Active customers (last 28 days) | 18,764 |
| Total trial starts | 291 |
| New paying customers | 24 |
| First paid conversions after stagnation | Achieved |
Google Ads funnel performance:
| Funnel stage | Before Strataigize | After optimization (10 days) |
|---|---|---|
| Installs | ~120/day | 6.7K+ over period |
| Account creates | Near zero | 3.6K |
| Trial starts | 1 to 2 | 200 |
| Purchases | 0 | 13 |
After months of zero conversions, subscriptions finally began moving. Thirteen purchases is a small number. Coming off zero, it is the only number that mattered.
“We were driving installs but couldn’t turn them into revenue. We were able to uncover major data inconsistencies between Google Ads and RevenueCat, fixed tracking, and rebuilt campaigns around real buyer intent. Within days, we finally started seeing subscription movement again. This is the most aligned our paid strategy has ever been with revenue.”
Abbey Dela Cruz, Strategic Director, Strataigize
Check Your Data Before You Blame the Ads
This case study proves one thing clearly. Growth rarely stalls because ads stop working. It stalls because the data stops telling the truth. By fixing broken conversion signals, aligning Google Ads with real revenue data, and filtering for high-intent users, Strataigize moved this security app from months of stagnation to its first real wave of paid subscriptions, fast.
So before you rewrite an ad or raise a bid, open your billing platform and your ad platform side by side and see whether they agree on last month. If your app is driving installs without revenue, or you are scaling spend without trusting your own numbers, the problem is almost never the traffic. It is the alignment underneath it. Our Google Ads and measurement overview explains how we connect the campaign and reporting tools used in this work.