TaskHive Needed Cleaners and Households Before It Had Either
TaskHive came to us with an empty marketplace. When its team joined our kickoff call in May 2026, the iPhone app had been in the App Store for three weeks, and nobody had posted a job yet. The model needs two kinds of user. A household posts a cleaning job for free, and local cleaners bid for the work. Cleaners pay $14.99 a month for the right
That model only works once both sides show up. A household will not post where nobody bids, and a cleaner will not pay to bid where nobody posts. Codi Varela, from TaskHive’s team, summed up the job on
“The vendor side is just as important as the
consumer side.” Codi Varela, TaskHive:
Cleaning Services
So we built both sides, one at a time. Between June 22 and October 15, 2026, our Meta ads brought TaskHive 3,035 app installs at $2.27 each. Of those people, 1,483 created an account and 225 started a subscription. Cost per install fell every month along the way, from $2.71 in the first nine days to $1.85
Cleaners Came First Because They Pay
Marketplaces fill from the supply side. A household that posts a job and hears nothing rarely posts again. In The Cold Start Problem, Andrew Chen calls supply the hard side of most marketplaces. Those are the users who do more of the work and are harder to win and to keep. On TaskHive the hard side also pays the bills, which made cleaners the first audience
Before the first ad ran, we went through the app the way a new cleaner and a new customer would. That audit found three places a newcomer could stall. Cleaner profiles carried few trust signals. Bidding could clash with a household’s fixed budget. And the paywall met cleaners before they had seen a
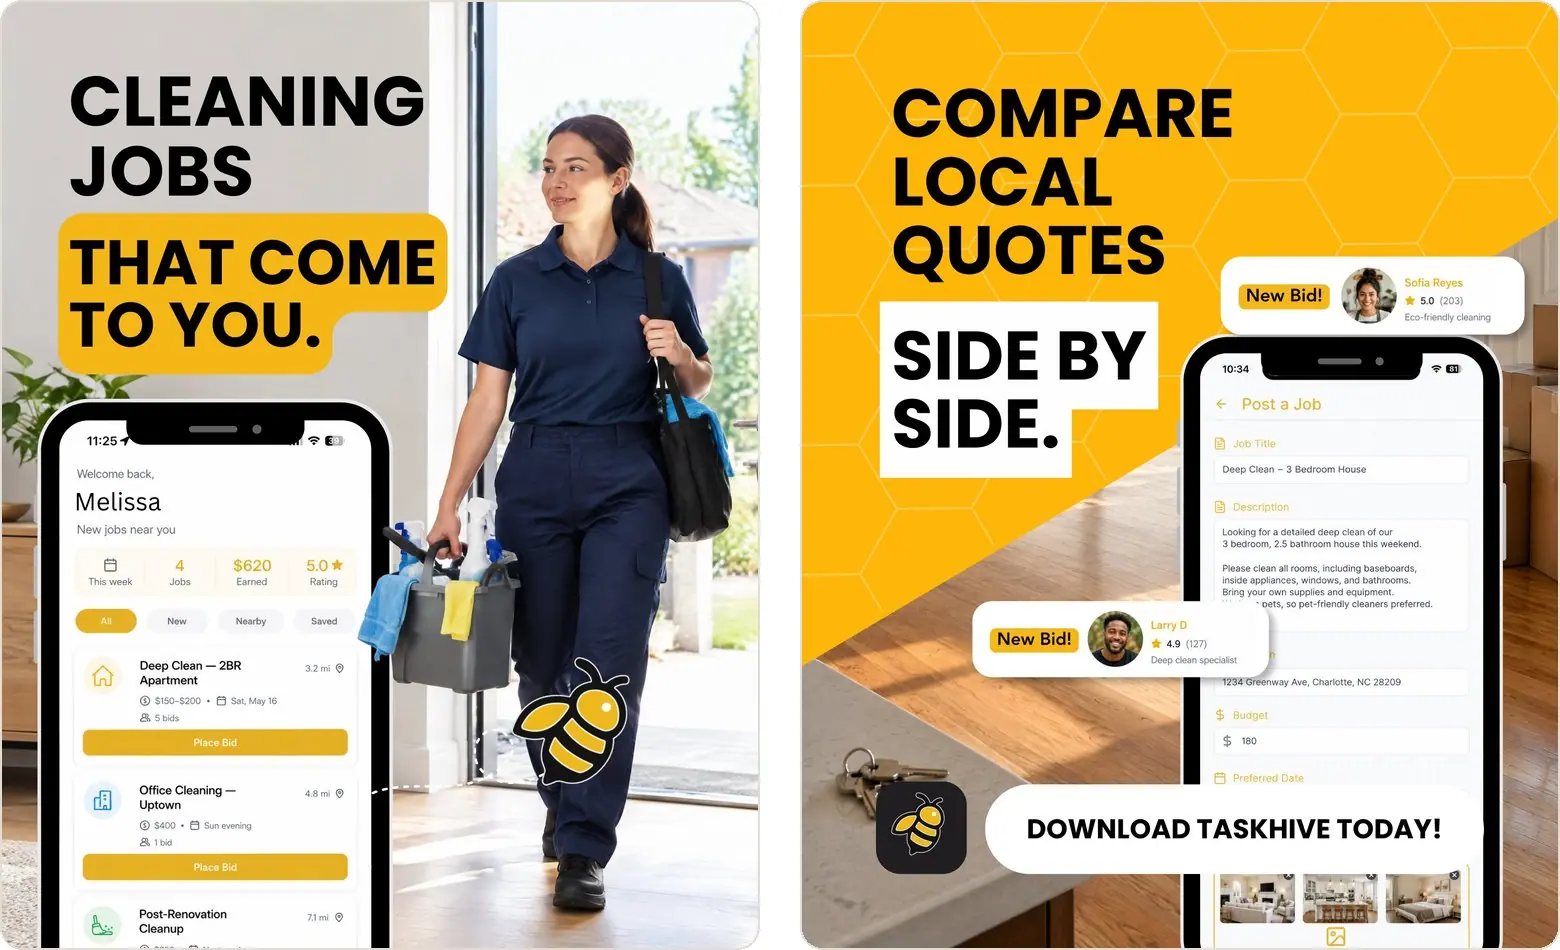
A paywall cannot be moved from an ad account, so we wrote the ads to answer those doubts first. The cleaner ads open on nearby jobs and what they pay. A cleaner knows what the subscription buys before the paywall asks
We also made sure the app reported more than downloads. Before launch we tested that new accounts and subscriptions reached Meta from the app, so every ad could be judged by what its installs became. The campaign itself stayed simple: iPhone users across the United States, broad targeting and about $50 a day. With targeting that broad, each ad picks its
Each Ad Spoke to One Side of the Market
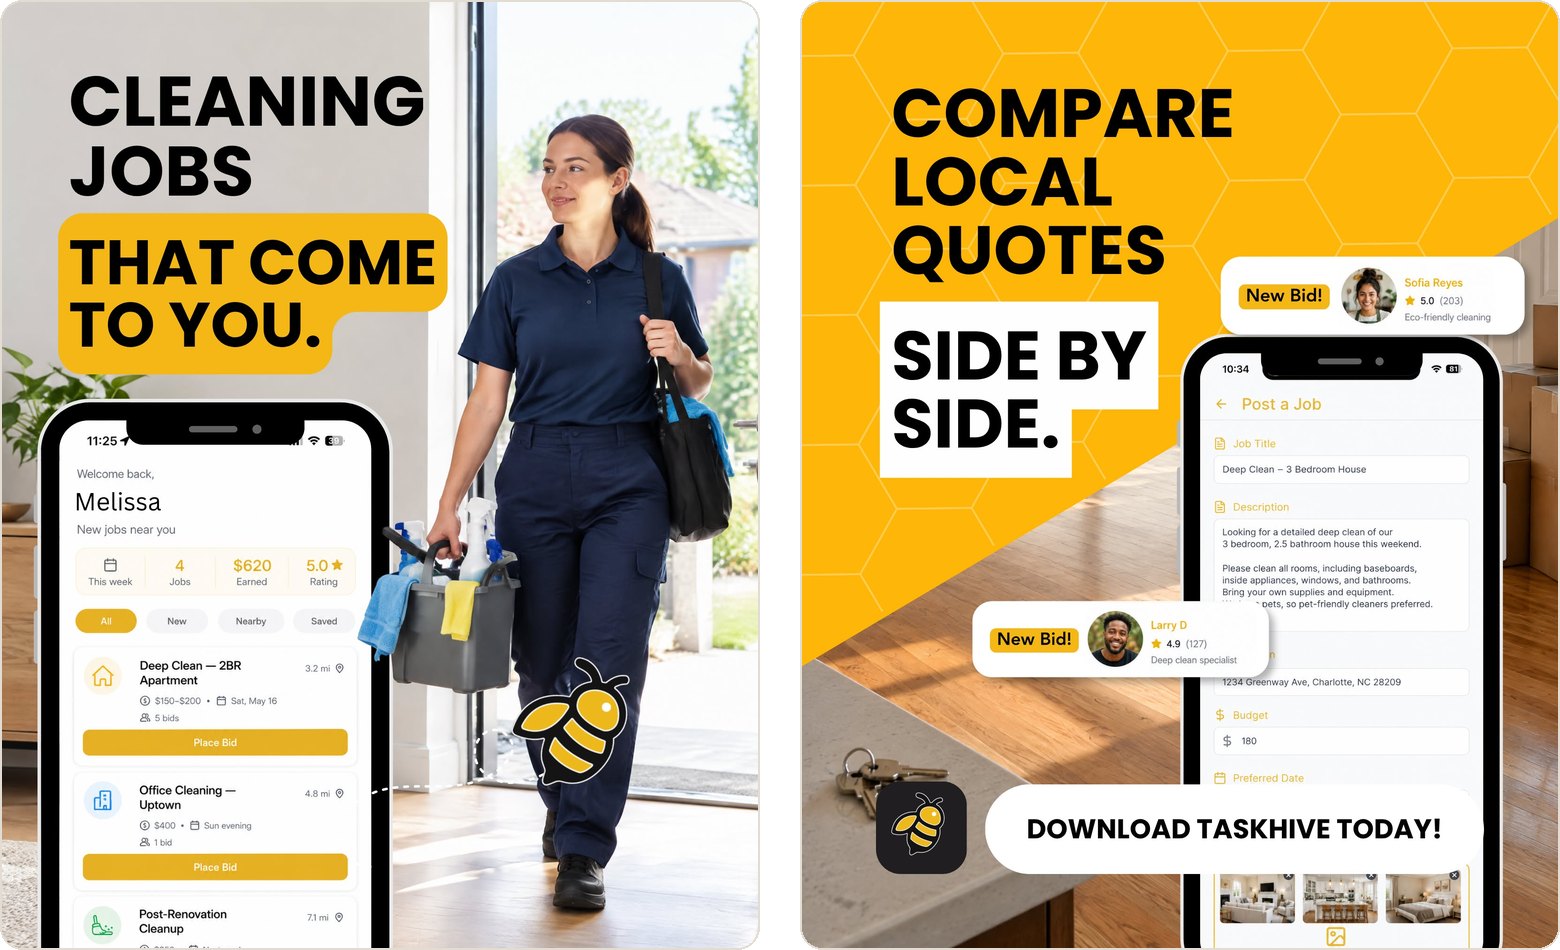
A cleaner and a household want different things from the same app. Our cleaner ads sold control over the work, with jobs close to home at a rate the cleaner sets. Our customer ads sold a fair price from someone you can check, with local quotes side by side and a rating beside
Both sets of ads were renewed about once a month, and each new batch had to beat the ads already running. The September batch produced the two ads that carried the account into October. “Cleaning jobs that come to you” brought 578 installs at $1.51 each, the lowest cost of any ad on the account that spent more than $100. Its customer-side partner, “Compare local quotes side by side,” brought 349 installs at $2.22. In the first half of October, those two ads delivered 82% of
Households Got Their Own Campaign When Cleaners Outpaced Jobs
By September the cleaner side was working, and that created the next problem. It showed up in the weekly account review run by Rebekka Goz, our Director of Operations. Cleaners were signing up faster than households were posting jobs. A cleaner who pays $14.99 a month and finds nothing to bid on has every reason to cancel, and the money spent winning that subscription
So on September 22 we added a second campaign, aimed only at households, with its own ads and about $50 a day of its own. Through October 15 it brought 489 installs at $2.40 each, and 262 of those people created an account. That is 54% of its installs, the higher account rate of the
This is acquisition that does the work of retention. Every household that posts a job gives a paying cleaner a reason to stay subscribed. If your app has a side that pays, its renewals depend on what the other
Cost per Install Fell Every Month
Each month’s cost per install came in below the month before, and by October it was 32% lower than in the launch window. Volume grew faster than spend. In July the account bought 19 installs a day on about $50. In October it bought 54 a day on
June covers June 22 to 30 and October covers October 1 to 15. Daily spend was about $50 until September 22 and about $100 after it. Each panel has its
| Month | Ad spend | Installs | Cost per install | Accounts | Subscriptions |
|---|---|---|---|---|---|
| June 22 to 30 | $344.72 | 127 | $2.71 | 82 | 13 |
| July | $1,561.85 | 586 | $2.67 | 245 | 43 |
| August | $1,568.41 | 618 | $2.54 | 194 | 24 |
| September | $1,898.70 | 891 | $2.13 | 503 | 90 |
| October 1 to 15 | $1,506.55 | 813 | $1.85 | 459 | 55 |
| Total | $6,880.23 | 3,035 | $2.27 | 1,483 | 225 |
New creative did most of that work. In October the two September ads delivered four installs in five, and the cleaner ad cost $1.50 per install. Cheaper ad space helped as well, with the cost of 1,000 impressions down from $19.30 in August to $16.16
These figures come from TaskHive’s Meta ad account, as does every number on this page. We pulled the data on October 16, 2026, for June 22 to October 15, in the account’s time zone, US Eastern. Installs, accounts and subscriptions are the app’s own events, as reported in Meta. A subscription is the app’s subscribe event, which Meta defines as the start of a
When an app update renamed those events in August, we mapped them again, but about a week of accounts and subscriptions never reached Meta. August’s figures in those two columns run low, so the totals are
Are Two-Dollar Installs Real Users?
Cheap installs often mean people who open an app once and leave. Close to half of these did more. Of 3,035 installs, 1,483 created an account. Subscriptions followed, 225 in all, about one for every 13 installs and one for every
Each subscription cost $30.58 in ads, roughly two months of what one cleaner pays TaskHive. A cleaner who stays for three months covers it, even after
The counts behind those costs are conservative. Meta can credit an iPhone install campaign with results up to seven days after a tap on the ad, and this account uses the 1-day click setting. An install, account or subscription that came after that first day is missing from
What Any Two-Sided or Subscription App Can Use
The lesson travels to any app with two sides. Win the side that pays first, then buy the other side as soon as the paying side runs short of things to do. An app with one side and a paywall runs on the same logic. Judge each ad by what its installs become, and fix the step where they stop, whether that is the store page, the paywall or the first week
That is how we run user acquisition, Meta ads, app store optimization (ASO) and retention for app teams, as one team on one number. ASO into ads. Ads into onboarding. Onboarding into retention. Retention
In May, TaskHive came to us with no jobs in its app. By the first half of October it was adding 54 installs a day, cleaners looking for work and households looking for a cleaner, at
If your app has two sides to fill, or a paywall most installs never reach, pick a time on our booking page for a free 30-minute call with a founder. We go through your funnel with you on the call, and you leave with your next